
Live dashboards give your team the most accurate picture of how enjoyable your game is to play. See exactly how patches and updates affect the community, and find new ways to activate your best players.
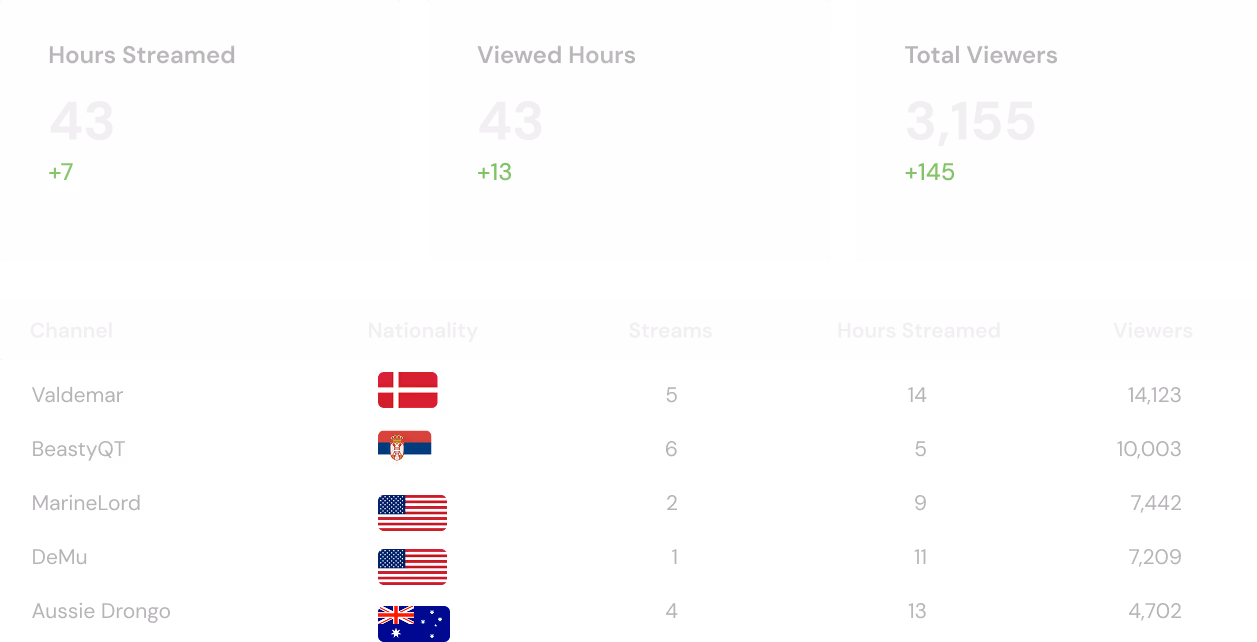
Keep track of your players across Steam, Reddit, YouTube, Discord, and more. Follow other titles to stay ahead of the competition and capitalize on market opportunities.
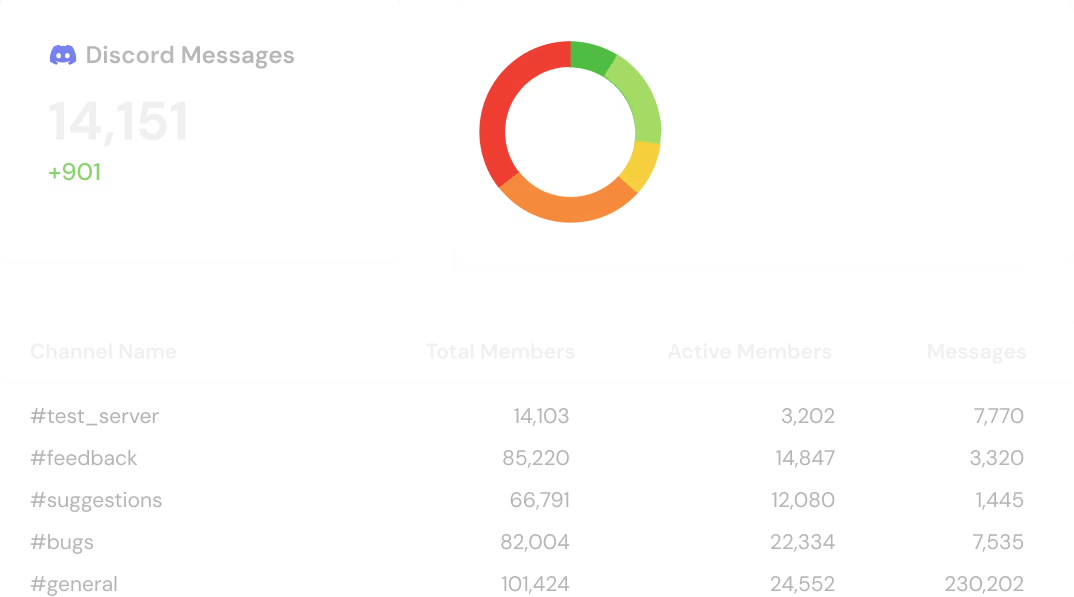
Measure Discord activity to empower your community and mods, support the channels that need the most help, and the monitor the overall health of your owned community.
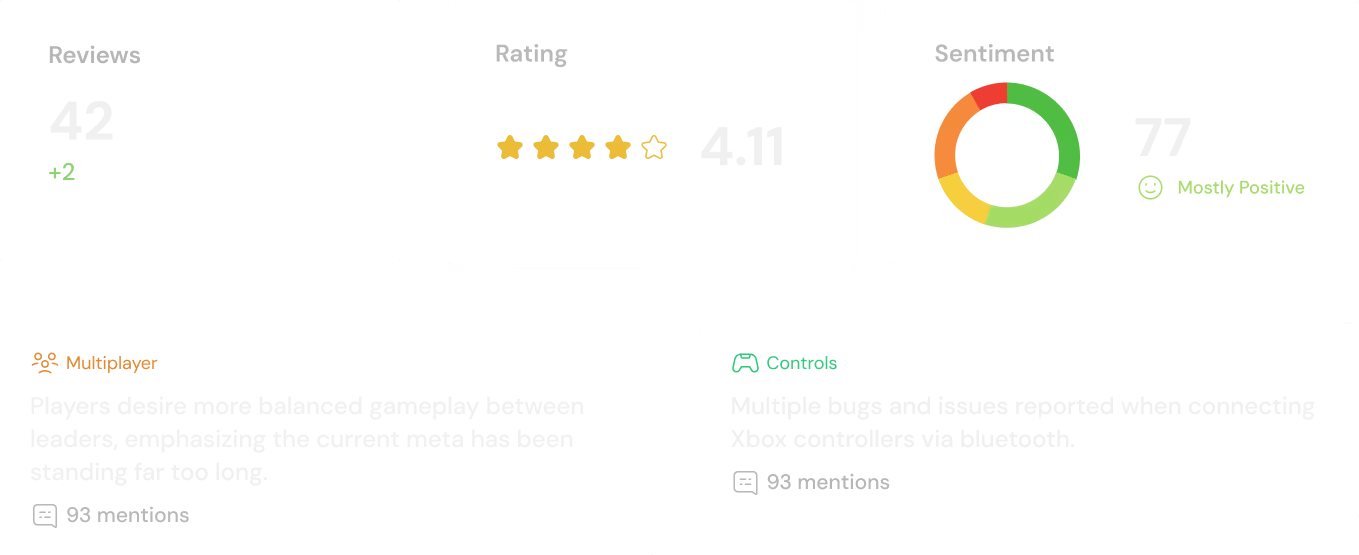
Monitor the overall health of your game directly from Steam data. Steam Discussions and review summaries keep you informed of how your players are feeling at any given moment.
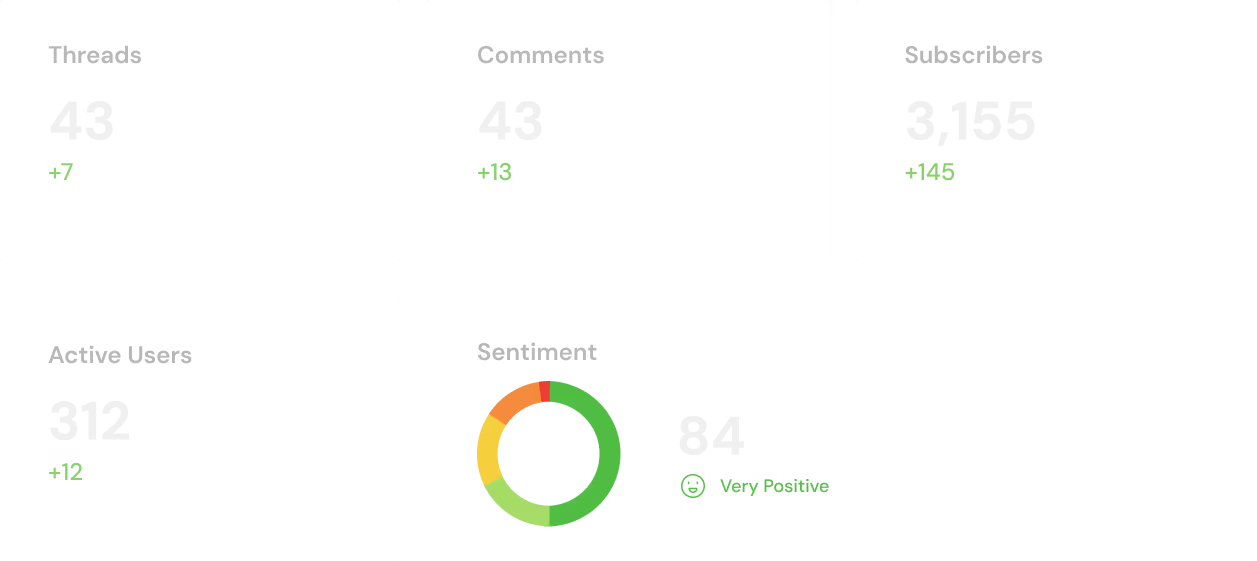
Follow the trends and activity of your most vocal players on Reddit. Know exactly what they are talking about, what's trending, and what problems need to be addressed.
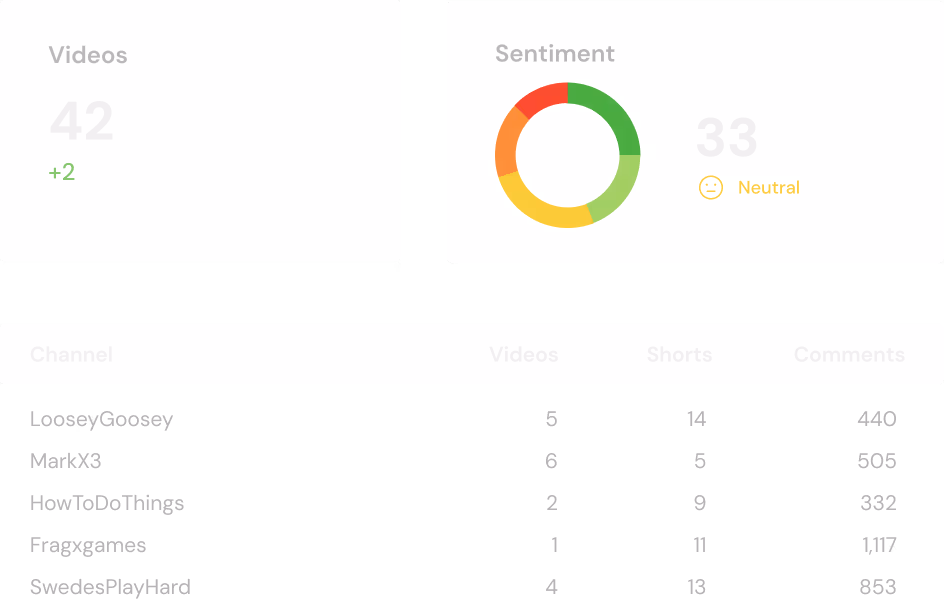
Measure the impact of your market and virality efforts on the world's largest video platform.
Get under the surfacea and build a stratagy about creators that truly moves the needle.
Real-time sentiment tracking to make sure your games are performing across all devices.
Ensure that your data is always up-to-date, accurate, and trustworthy. No more manual refreshes or reconnections with 90% guaranteed uptime.
Translate incoming content into any language.

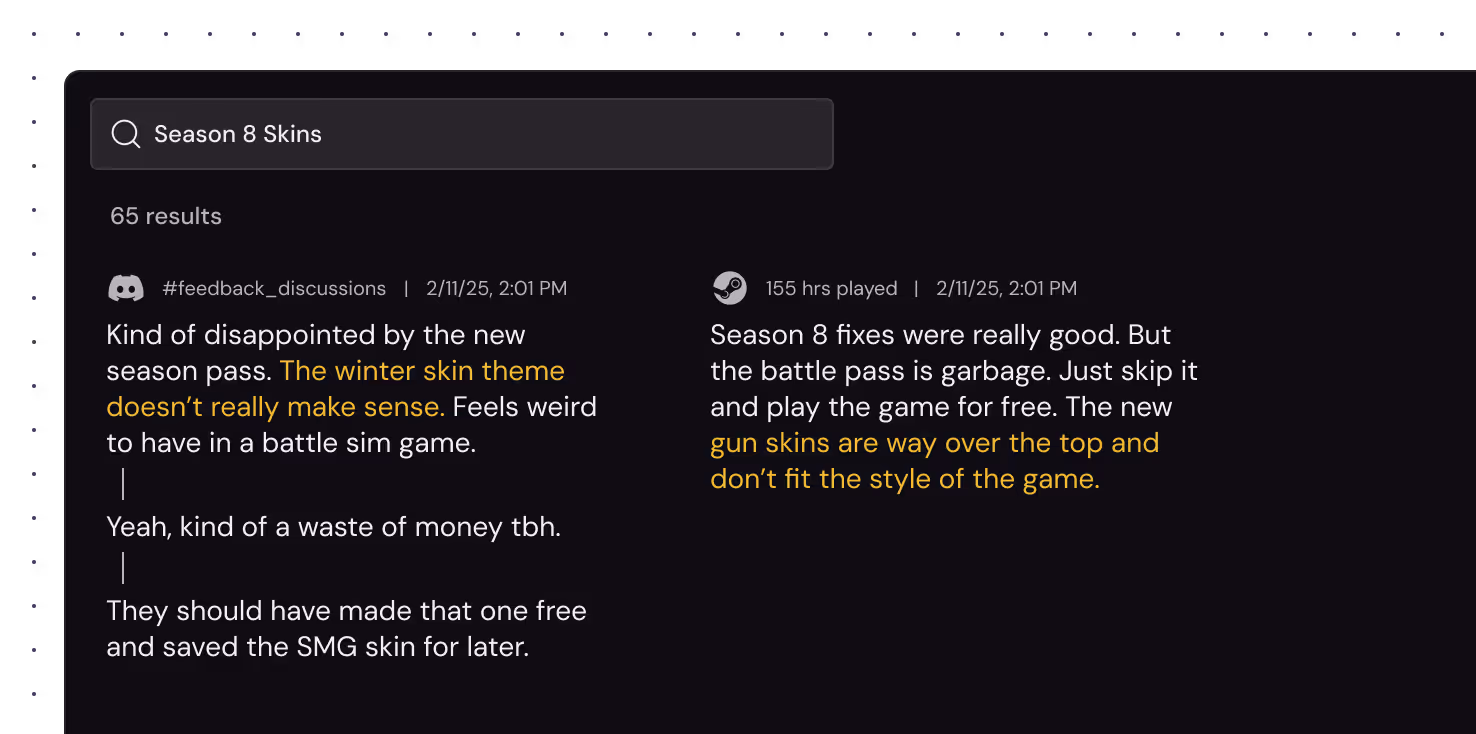
View and filter content by hours played of your game.

Explore feedback from all your content sources at once.
Get alerted when an important individual is driving a particular conversation.

Personalize your dashboard to combine games, platforms, and metrics that matter most to you.
Sign up for a 14-day free trial. No payment or commitment required.
Schedule a DemoThe dashboard comes standard with about 24 metrics. You can add as many as you would like. We advise to stay below 40 metrics to optimize speed and performance.
All charts and KPIs can be downloaded in a PNG, JPG, SVG, or PDF. In addition, some dashboard pages have shareable links to pass on live data to other members on your team or stakeholders that might be interested.
We will capture 100% of data for any game up to 1 year old. For games that have been released further in the past, we can backfill as much as possible on request. Once a game is live in Kinn, the new data continues to be ingested as long as you're using it.
We currently don't support exporting raw data vs CSV or Excel.
You can track up to 5 games on a standard account. If you need additional games added to your dashboard, you can reach out via our support team at support@kinn.gg.
Games currently operate independent of each other and can not have data crossed or merged.
Certainly! We are always looking for new metrics to add. Please let our team know what you would like to see by emailing us at support@kinn.gg.
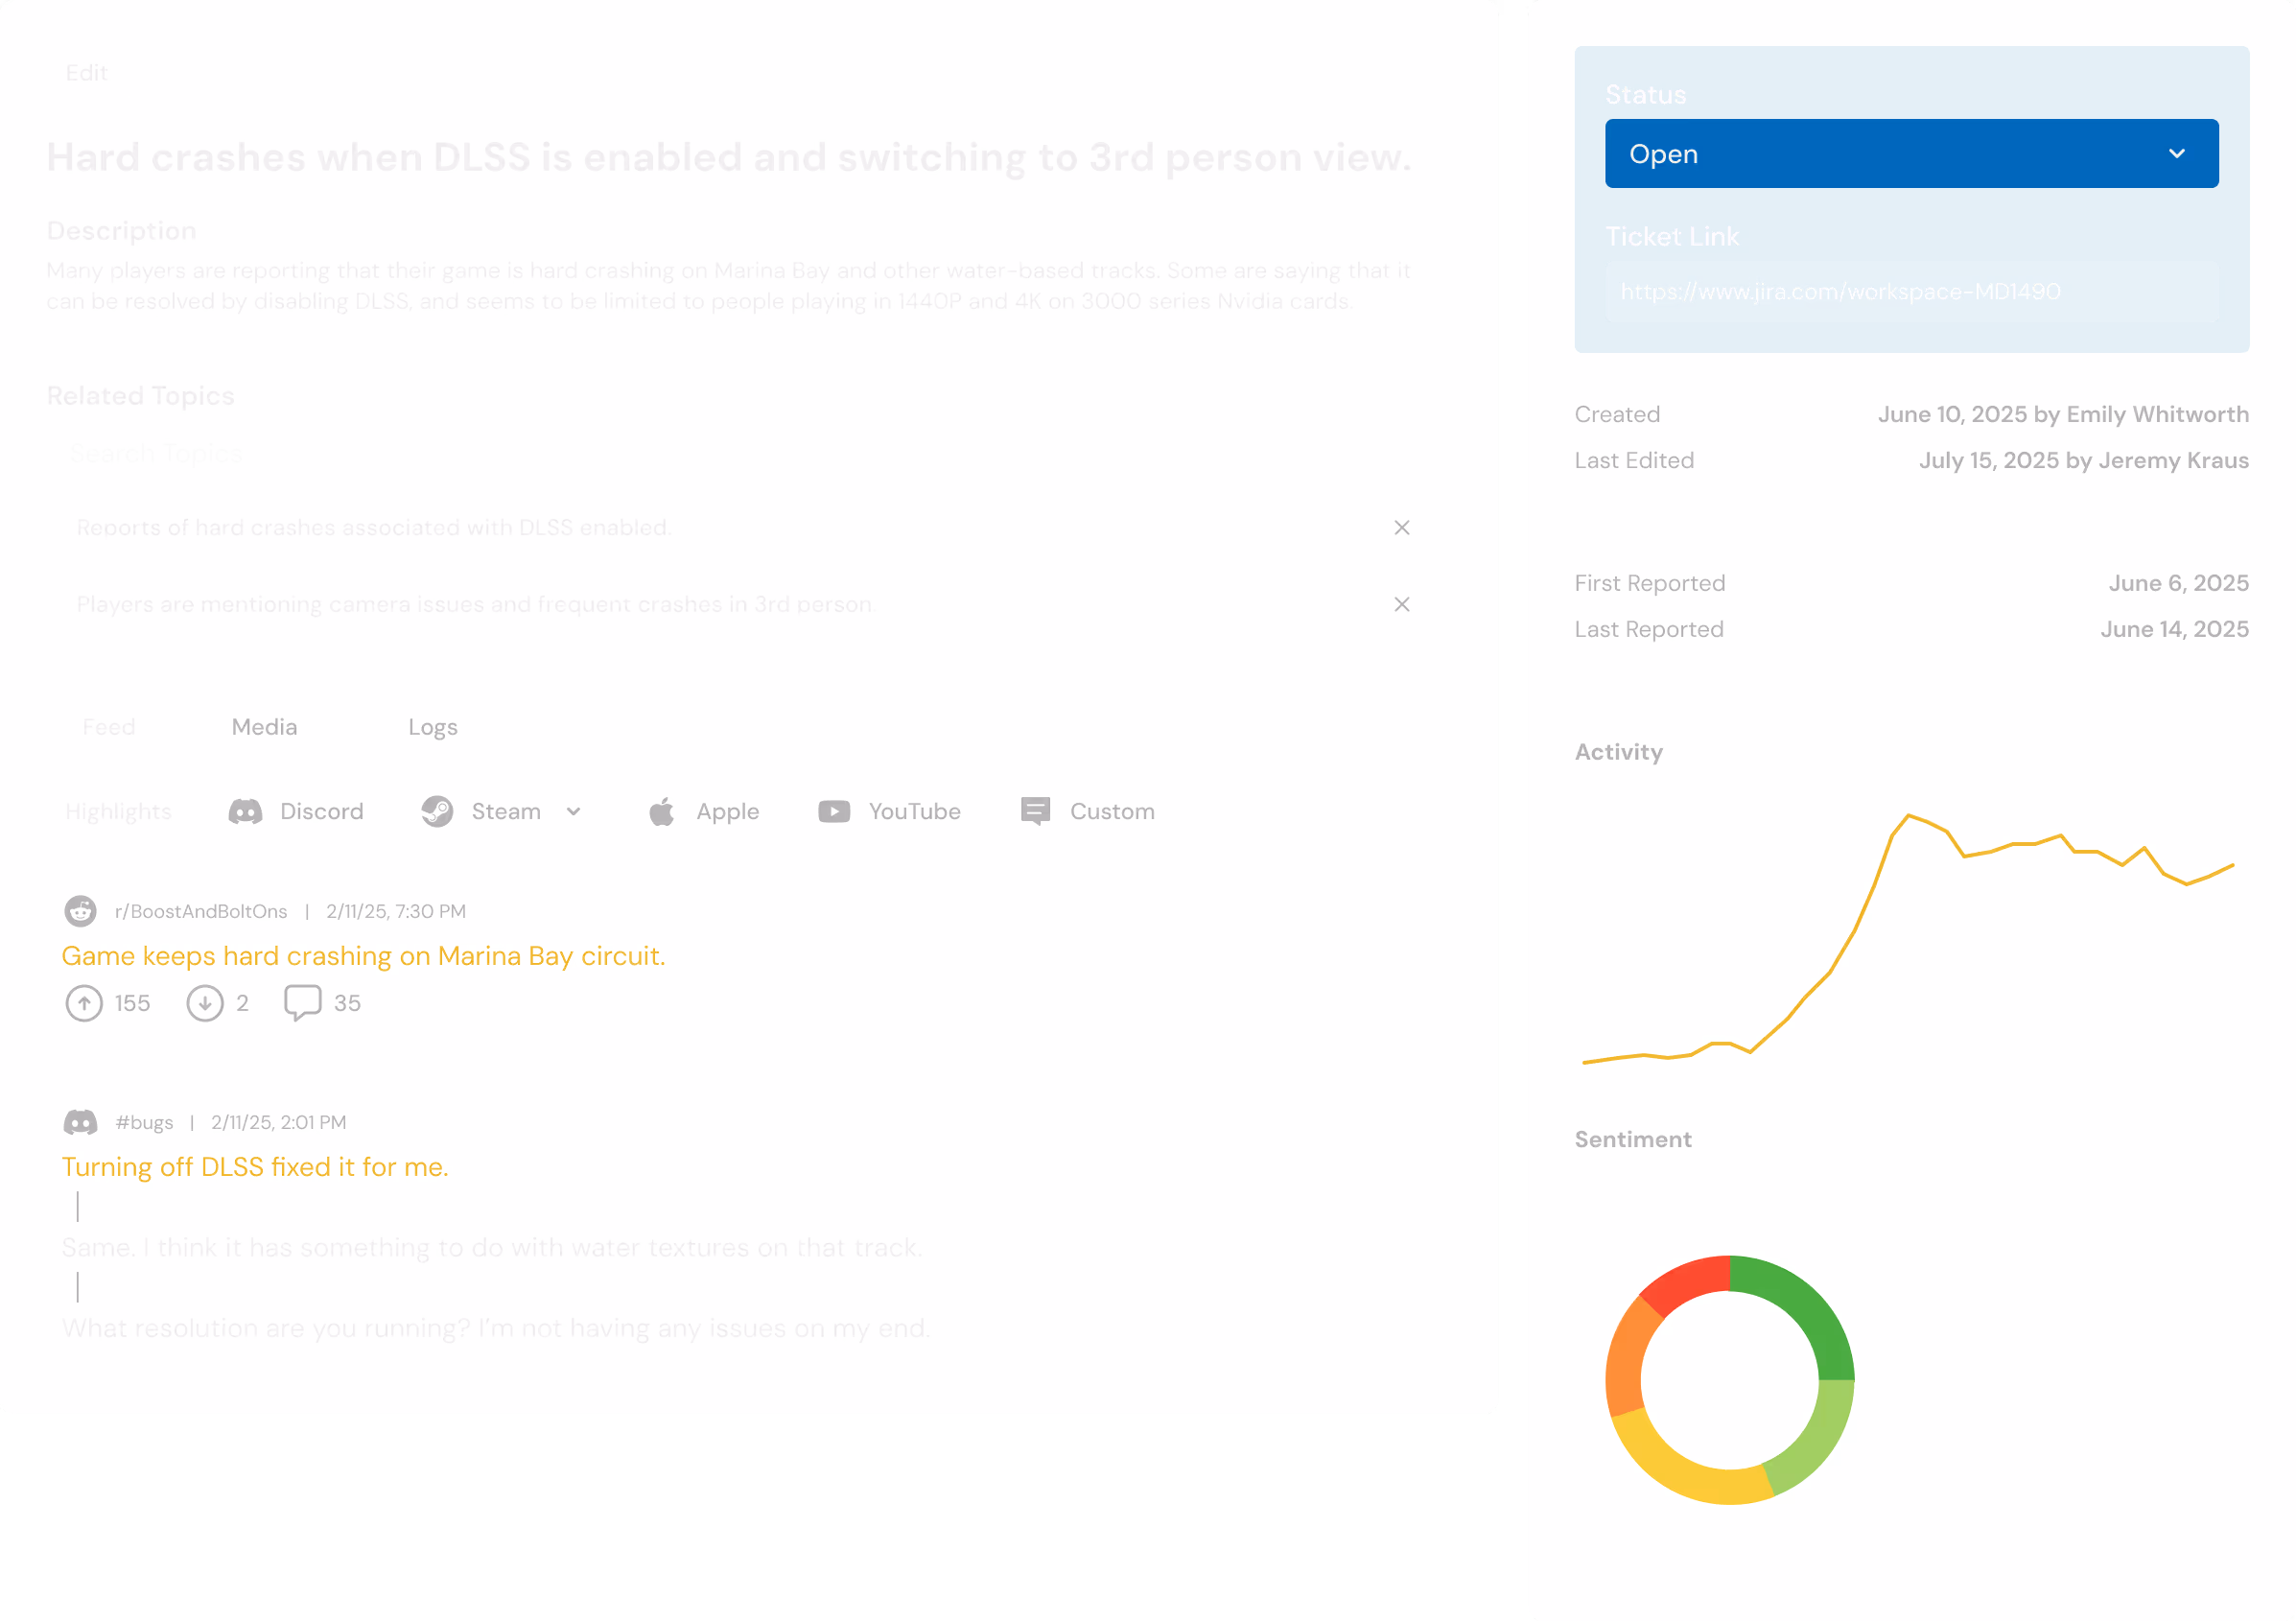
It can be tough to understand how changes directly impact your game. Monitor the conversations and feedback from around the web with Kinn's powerful topic and sentiment sorting software.
Explore Feedback Topics

